
uk burglary statistics
No suspect identified: what police data to July 2026 says about burglary and home CCTV
A data study by CCTV Master using police.uk open data to July 2026.
On this page
A data study by CCTV Master using police.uk open data to July 2026. Updated quarterly; this edition was published 16 September 2026.
Key findings
- Most burglaries end without a suspect. Of 196,340 burglaries recorded in the year to July 2025 across 37 police forces in England and Wales, 72.7% (142,652) had "Investigation complete; no suspect identified" as their latest outcome on police.uk.
- Only 7.3% reached a court-related outcome (14,317). A further 15.5% had a suspect but the case could not be taken forward.
- Vehicle crime is starker. 83.2% of 280,461 vehicle crimes ended with no suspect identified, and 3.0% reached a court-related outcome.
- Burglary fell overall, but not everywhere. Recorded burglary changed by -4.1% across 38 forces (203,347 to 195,095) between the year to July 2025 and the year to July 2026, and rose in 14 of them.
- London: burglary changed by -3.7%, rising in 14 of 33 local authorities, led by Hounslow (+16.9%), Bexley (+14.3%), Ealing (+10.5%).
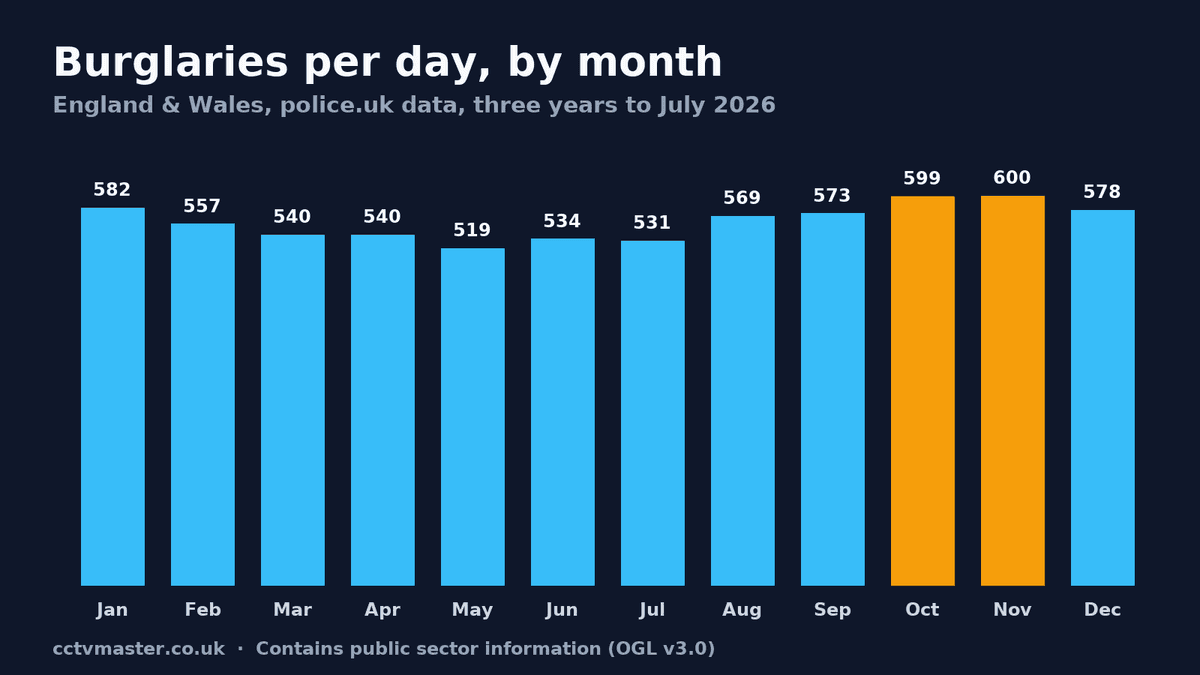
- November (600 a day) and October (599 a day) were the busiest months for burglary over three years, 15.6% above May, the quietest (519 a day).
1. Most burglaries end with no suspect identified
police.uk publishes the latest outcome for every recorded crime. We took every burglary recorded between August 2024 and July 2025, so each case had at least a year to progress before the July 2026 data release. Across the 37 forces with usable outcome data:
| Latest outcome (police.uk category) | Burglaries | Share |
|---|---|---|
| Investigation complete; no suspect identified | 142,652 | 72.7% |
| Unable to prosecute suspect | 30,475 | 15.5% |
| Court-related (awaiting court outcome, court result unavailable, or charged as part of another case) | 14,317 | 7.3% |
| Status update unavailable | 7,220 | 3.7% |
| Other (under investigation, caution, local resolution, etc.) | 1,676 | 0.9% |
| Total | 196,340 |
How often "no suspect" was the outcome varies by force:
| Highest share | Lowest share |
|---|---|
| South Yorkshire Police 81.4% | Cumbria Constabulary 47.6% |
| Hertfordshire Constabulary 79.6% | North Wales Police 53.3% |
| Metropolitan Police Service 78.7% | Dyfed-Powys Police 54.9% |
Differences partly reflect how each force records and reports outcomes, so this is not a league table of police performance.
Why this matters for CCTV. The data does not say whether a camera was present, so it cannot show that CCTV changes outcomes. What it does show is that the step where most burglary cases stop is identifying a suspect — the job footage is expected to help with. Footage only helps if it is usable: a face or vehicle that can be made out, a correct timestamp, and a recording that still exists when police ask for it.
2. Vehicle crime
For the same period and forces there were 280,461 vehicle crimes: 233,444 (83.2%) ended with no suspect identified, 29,683 (10.6%) were "Unable to prosecute suspect", and 8,289 (3.0%) reached a court-related outcome. Recorded vehicle crime changed by -4.5% across 38 forces (289,698 to 276,631) and rose in 13 of them.
3. Where burglary rose and fell, by force
Recorded burglary, year to July 2025 compared with year to July 2026 (38 forces):
| Force | Year to july 2025 | Year to july 2026 | Change |
|---|---|---|---|
| Gwent Police | 2,113 | 2,499 | +18.3% |
| Avon and Somerset Constabulary | 7,007 | 7,684 | +9.7% |
| Cumbria Constabulary | 995 | 1,077 | +8.2% |
| Warwickshire Police | 2,166 | 2,318 | +7.0% |
| Lincolnshire Police | 2,313 | 2,470 | +6.8% |
| City of London Police | 391 | 417 | +6.6% |
| West Mercia Police | 3,958 | 4,205 | +6.2% |
| Durham Constabulary | 2,863 | 3,039 | +6.1% |
| Cambridgeshire Constabulary | 2,971 | 3,135 | +5.5% |
| Derbyshire Constabulary | 2,996 | 3,095 | +3.3% |
| Wiltshire Police | 1,577 | 1,627 | +3.2% |
| Nottinghamshire Police | 4,088 | 4,190 | +2.5% |
| Cleveland Police | 3,706 | 3,790 | +2.3% |
| Staffordshire Police | 3,647 | 3,708 | +1.7% |
| Thames Valley Police | 6,803 | 6,797 | -0.1% |
| Suffolk Constabulary | 1,801 | 1,788 | -0.7% |
| Humberside Police | 4,595 | 4,473 | -2.7% |
| Northamptonshire Police | 2,863 | 2,787 | -2.7% |
| Essex Police | 5,480 | 5,293 | -3.4% |
| Cheshire Constabulary | 2,530 | 2,437 | -3.7% |
| Metropolitan Police Service | 49,213 | 47,397 | -3.7% |
| Devon & Cornwall Police | 3,787 | 3,581 | -5.4% |
| Surrey Police | 3,146 | 2,977 | -5.4% |
| West Midlands Police | 15,113 | 14,275 | -5.5% |
| West Yorkshire Police | 14,967 | 14,043 | -6.2% |
| Norfolk Constabulary | 1,919 | 1,796 | -6.4% |
| North Wales Police | 1,765 | 1,646 | -6.7% |
| Leicestershire Police | 4,677 | 4,300 | -8.1% |
| Hertfordshire Constabulary | 4,008 | 3,678 | -8.2% |
| Merseyside Police | 4,196 | 3,817 | -9.0% |
| Lancashire Constabulary | 6,546 | 5,918 | -9.6% |
| Dorset Police | 2,277 | 1,997 | -12.3% |
| Sussex Police | 4,900 | 4,208 | -14.1% |
| South Wales Police | 3,644 | 3,124 | -14.3% |
| South Yorkshire Police | 9,223 | 7,844 | -15.0% |
| Dyfed-Powys Police | 1,670 | 1,412 | -15.4% |
| Kent Police | 5,142 | 4,328 | -15.8% |
| Bedfordshire Police | 2,291 | 1,925 | -16.0% |
| All 38 forces | 203,347 | 195,095 | -4.1% |
These are counts, not rates per household, so larger forces naturally show larger numbers. Changes in recording practice can also move a force's figures.
4. London: burglary rose in 14 of 33 local authorities
police.uk places each crime in a small area (LSOA). Grouping those areas by local authority gives this picture for London:
| Local authority | Year to july 2025 | Year to july 2026 | Change | No suspect identified (year to July 2025) |
|---|---|---|---|---|
| Hounslow | 1,239 | 1,448 | +16.9% | 80.9% |
| Bexley | 705 | 806 | +14.3% | 74.8% |
| City of London | 426 | 475 | +11.5% | 54.9% |
| Ealing | 1,686 | 1,863 | +10.5% | 81.2% |
| Tower Hamlets | 2,203 | 2,435 | +10.5% | 78.4% |
| Harrow | 1,110 | 1,222 | +10.1% | 83.4% |
| Enfield | 1,845 | 2,021 | +9.5% | 80.8% |
| Brent | 1,631 | 1,775 | +8.8% | 78.9% |
| Newham | 1,647 | 1,776 | +7.8% | 80.1% |
| Lewisham | 1,525 | 1,575 | +3.3% | 76.5% |
| Barking and Dagenham | 921 | 928 | +0.8% | 77.0% |
| Redbridge | 1,162 | 1,169 | +0.6% | 79.2% |
| Hillingdon | 1,439 | 1,441 | +0.1% | 80.3% |
| Wandsworth | 1,649 | 1,651 | +0.1% | 79.6% |
| Waltham Forest | 1,313 | 1,304 | -0.7% | 79.4% |
| Barnet | 2,213 | 2,169 | -2.0% | 82.2% |
| Camden | 2,208 | 2,101 | -4.8% | 72.4% |
| Greenwich | 1,501 | 1,406 | -6.3% | 74.0% |
| Lambeth | 1,948 | 1,794 | -7.9% | 80.3% |
| Bromley | 1,380 | 1,237 | -10.4% | 77.5% |
| Southwark | 2,561 | 2,287 | -10.7% | 82.5% |
| Croydon | 1,913 | 1,706 | -10.8% | 78.6% |
| Hackney | 2,029 | 1,809 | -10.8% | 77.6% |
| Hammersmith and Fulham | 1,263 | 1,120 | -11.3% | 75.9% |
| Kensington and Chelsea | 1,369 | 1,200 | -12.3% | 75.3% |
| Westminster | 2,932 | 2,558 | -12.8% | 76.0% |
| Sutton | 887 | 761 | -14.2% | 79.4% |
| Havering | 1,006 | 861 | -14.4% | 79.1% |
| Islington | 1,797 | 1,537 | -14.5% | 76.6% |
| Haringey | 1,616 | 1,362 | -15.7% | 82.0% |
| Kingston upon Thames | 604 | 504 | -16.6% | 78.6% |
| Richmond upon Thames | 982 | 796 | -18.9% | 79.8% |
| Merton | 870 | 670 | -23.0% | 78.6% |
| London total | 49,580 | 47,767 | -3.7% | 78.5% |
Across London, 78.5% of burglaries in the year to July 2025 ended with no suspect identified, against 72.7% across the 37 forces.
5. Burglary peaks when the clocks go back
Across 36 forces and three full years (August 2023 to July 2026; 614,023 burglaries), the average number of burglaries per day in each calendar month was:
| Month | Per day | Month | Per day |
|---|---|---|---|
| November | 600 | May | 519 |
| October | 599 | July | 531 |
| January | 582 | June | 534 |
| December | 578 | April | 540 |
| September | 573 | March | 540 |
| August | 569 | February | 557 |
November's daily average is 15.6% higher than May's. Vehicle crime peaked in October (887 a day) and was lowest in December (764 a day).
The data cannot say why, and it has no time-of-day field. The rise does coincide with darker evenings — which is also when cameras switch to infrared or low-light mode, and when image quality is most often at its weakest.
6. What this means if you have, or are planning, CCTV
This section is practical guidance, not a finding from the data.
- Identification is the gap. A camera that shows something happened is less useful than one that shows who. Check your footage at night, not just in daylight: can you make out a face at the door, or a number plate on the drive?
- Check the clock. Footage with the wrong date or time is harder to use. Check your recorder's time after every clock change (the last Sundays of March and October).
- Keep footage long enough to hand over. If a crime is discovered late, the recording needs to still exist. Work out how many days your recorder holds with the CCTV storage calculator. The ICO also expects you to "delete the footage regularly or automatically", so set a retention period rather than keeping it forever.
- Know the rules if you record beyond your boundary. The ICO says that if home CCTV "records beyond your property boundary, data protection law applies". Capture no more than you need, "install signage that indicates CCTV is in operation", store footage securely, delete it regularly, and be ready to respond to requests from people who appear in it.
Methodology
- Source. The police.uk bulk archive for July 2026 (
https://data.police.uk/data/archive/2026-07.zip), holding street-level crime and outcome files for August 2023 to July 2026 for every force that supplied them. - Categories. "Burglary" (which on police.uk covers homes and businesses) and "Vehicle crime".
- Windows. The year to July 2025 means August 2024 – July 2025; the year to July 2026 means August 2025 – July 2026.
- Outcomes are the "Last outcome category" field — the most recent outcome linked to the crime. "Court-related" combines "Awaiting court outcome", "Court result unavailable" and "Suspect charged as part of another case".
- Coverage. British Transport Police (not a territorial force) and Northern Ireland are not included. Excluded from the trend figures because of missing or incomplete months: Gloucestershire Constabulary, Hampshire Constabulary, North Yorkshire Police, Northumbria Police. Also excluded from the outcome figures because most of their burglaries show "Status update unavailable": Avon and Somerset Constabulary. Excluded from the seasonal figures: Dyfed-Powys Police, Gwent Police. A force with no files in the archive (at the time of writing, Greater Manchester Police) cannot be included.
- London figures group crimes by the local authority named in the LSOA field. police.uk moves each crime to a nearby anonymous map point before publishing, so a few crimes near a boundary may fall in a neighbouring borough.
- Counts, not rates, and not official statistics: police.uk figures are operational data and can differ from ONS and Home Office publications.
- Reproducible. Every figure can be recomputed from the archive; the method is applied the same way at each quarterly update.
Sources
- police.uk open data and API
- police.uk data archive and field definitions
- ICO: home CCTV systems
- GOV.UK: guidance on the use of domestic CCTV
- Neighbourhood Watch: CCTV advice
- Secured by Design: home security advice
Contains public sector information licensed under the Open Government Licence v3.0.
Free to reuse: journalists, community groups and trade publications may quote or reproduce these tables with a link to this page.
About this study. Compiled by CCTV Master Ltd (company no. 16356510), a UK supplier of CCTV equipment to the public and to installers, with a trade counter on Quill St, Hanger Lane, London W5 1DN. We supply equipment; we do not install it. No police force or public body was involved in, or has endorsed, this analysis.
This article was researched and written by IT Master's AI SEO content engine.
