
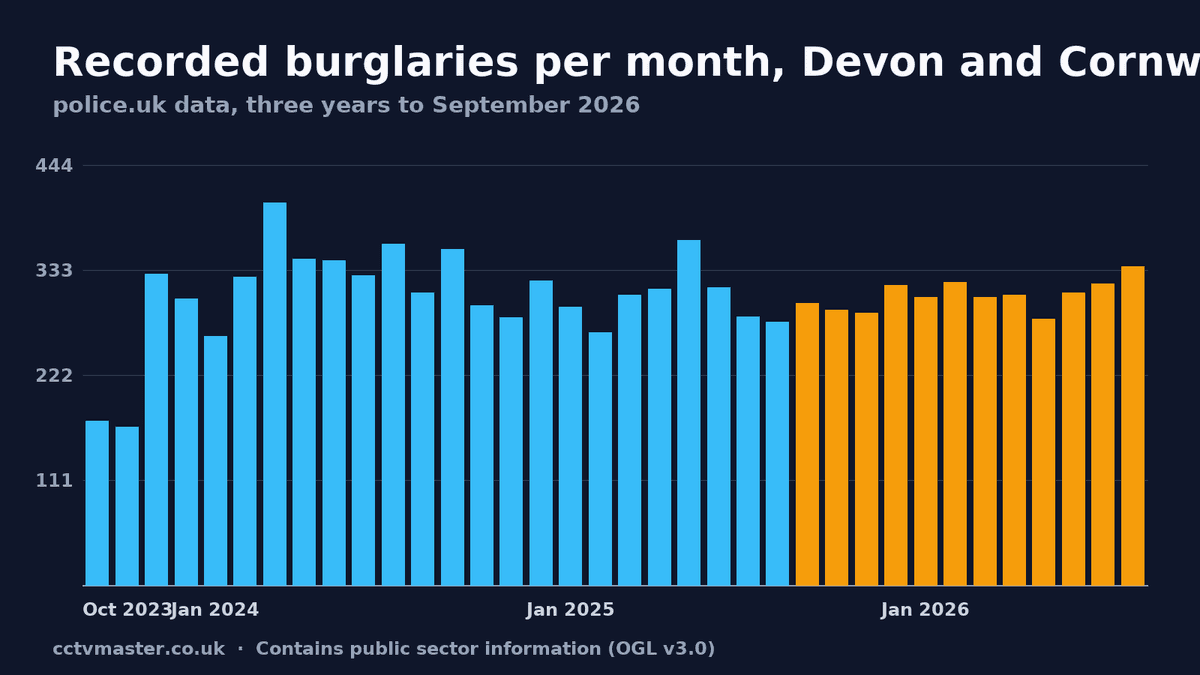
Police.uk open data for Devon and Cornwall to September 2026, analysed by CCTV Master. Part of our UK burglary study; updated quarterly; this edition was published 10 November 2026.
Key findings
- Devon & Cornwall Police recorded 3,675 burglaries in the year to September 2026, against 3,679 in the year before (-0.1%). The change does not pass this study's test for a rise or a fall (at least 10% and statistically clear against Devon and Cornwall's month-to-month variation), so we describe it as little changed.
- Council areas: burglary fell in 1 of the 12 council areas below; in the rest the change was too small to call.
- Outcomes: 59.5% of burglaries recorded in the year to September 2025 ended with no suspect identified, against 72.7% across England and Wales.
- Busiest month: April averaged 11.3 burglaries a day over three years, 34.5% more than November.
- Nationally: burglary changed by -2.2% across 38 forces and rose in 16 of them; Devon and Cornwall's change ranks 17 of 38 (1 is the largest rise).
Burglary by council area in Devon and Cornwall
Recorded burglaries in each council area where Devon & Cornwall Police recorded at least 80% of the burglaries:
| Council area | Year to September 2025 | Year to September 2026 | Change | Per 1,000 residents | No suspect identified (year to September 2025) |
|---|---|---|---|---|---|
| Cornwall | 928 | 965 | +4.0% (little changed) | 1.7 | 58.7% |
| East Devon | 260 | 213 | -18.1% (little changed) | 1.4 | 65.4% |
| Exeter | 389 | 430 | +10.5% (little changed) | 3.3 | 58.1% |
| Isles of Scilly | 1 | 6 | — | — | — |
| Mid Devon | 178 | 152 | -14.6% (little changed) | 1.8 | 64.0% |
| North Devon | 213 | 211 | -0.9% (little changed) | 2.1 | 57.7% |
| Plymouth | 547 | 580 | +6.0% (little changed) | 2.2 | 53.2% |
| South Hams | 166 | 118 | -28.9% (fell) | 1.3 | 63.3% |
| Teignbridge | 253 | 263 | +4.0% (little changed) | 2.0 | 68.0% |
| Torbay | 374 | 423 | +13.1% (little changed) | 3.0 | 54.5% |
| Torridge | 111 | 119 | +7.2% (little changed) | 1.7 | 68.5% |
| West Devon | 93 | 68 | — | — | — |
A change is called a rise or a fall only when it is statistically clear and at least 10%; see how the study is compiled. Rates use Census 2021 residents. police.uk burglary includes business premises, so council areas with many businesses and few residents show higher rates: they are context, not a ranking. A further 4 burglaries recorded by Devon & Cornwall Police in the year to September 2026 were placed in council areas mostly policed by other forces (Bournemouth, Christchurch and Poole, Preston, Somerset, Stroud); they count towards the force total but not the table.
What happened to burglaries in Devon and Cornwall
Latest outcome on police.uk for burglaries recorded in the year to September 2025, so each case had at least a year to progress:
| Latest outcome | Devon and Cornwall | England and Wales |
|---|---|---|
| Investigation complete; no suspect identified | 59.5% (2,097) | 72.7% |
| Unable to prosecute suspect | 25.0% (879) | 15.6% |
| Court-related | 8.2% (290) | 7.3% |
| Status update unavailable | 4.6% (162) | 3.6% |
| Other outcomes | 2.7% (95) | 0.8% |
Based on 3,523 burglaries. Differences partly reflect how each force records outcomes, so this is not a measure of police performance.
When burglary peaks in Devon and Cornwall
Average recorded burglaries per day in each calendar month, over three years (October 2023 to September 2026):
| Month | Per day |
|---|---|
| January | 10.1 |
| February | 10.1 |
| March | 9.8 |
| April | 11.3 |
| May | 10.4 |
| June | 11.0 |
| July | 10.2 |
| August | 10.4 |
| September | 10.3 |
| October | 8.9 |
| November | 8.4 |
| December | 9.7 |
Data notes
- Figures are police.uk street-level records for Devon & Cornwall Police, October 2023 to September 2026. They are operational data, not official statistics, and can differ from ONS and Home Office publications.
- 3.3% of the burglaries the force recorded in the year to September 2026 had no location; they count towards the force total only.
- How the study is compiled: methodology.
Edition history
Figures quoted from an earlier edition stay traceable here:
| Edition | Burglaries (year to edition) | Change on the year before |
|---|---|---|
| August 2026 | 3,616 | -2.5% |
| September 2026 | 3,675 | -0.1% |
If you are reviewing your home security
This section is practical guidance, not a finding from the data.
- Check what your cameras show at night. Most burglaries end without a suspect being identified, and a camera only helps if a face or a number plate can be made out after dark.
- Keep footage long enough to hand over. A burglary discovered days later needs a recording that still exists. Work out how many days your recorder holds with the CCTV storage calculator.
- Know the rules before you record beyond your boundary. Our UK burglary study summarises the ICO guidance on home CCTV.
Reuse and sources
- police.uk open data and its September 2026 archive.
- Population: Office for National Statistics, Census 2021 usual residents (Nomis).
Contains public sector information licensed under the Open Government Licence v3.0.
Free to reuse: journalists and community groups may quote these figures; please credit CCTV Master with a link (any rel is fine). A spreadsheet of the tables is available on request from CCTV Master.
Cite this page: CCTV Master (2026), "Burglary in Devon and Cornwall: police data to September 2026", published 10 November 2026, https://cctvmaster.co.uk/blog/burglary-statistics-devon-and-cornwall. Data: police.uk to September 2026, Open Government Licence v3.0.
About this study. Compiled by CCTV Master, Quill St, Hanger Ln, London W5 1DN. CCTV Master is operated by CCTV MASTER LTD (company number 16356510). No police force or public body was involved in, or has endorsed, this analysis.